|
Crash Analysis
Once the crashes in the study have been reviewed and confirmed (or excluded), the next step involves a detailed review of crash data to identify crash patterns and contributing factors. This involves a review of crash summaries by collision type, crash severity, time of day, day of week, weather condition, light condition, and more. Tabular summaries, bar charts, and pie charts are useful for displaying these descriptive statistics. Collision diagrams and statistical tests help to further diagnose crash contributing factors and identify over-represented crash types. After reviewing the various crash data summaries, statistical tests, and collision diagrams, the analyst can select one or more crash patterns and/or contributing factors to support countermeasure selection. The following is a description of the various descriptive statistics, statistical tests, and tools available in CLEAR Safety to help identify crash patterns and over-represented safety issues.
Overview
When the Crash Analysis page is displayed, there is a panel on the left containing a series of accordion panels/controls, while the right side of the page is the main area for presenting the crash data for various types of analysis. The image below illustrates the Crash Analysis page.
.png)
The right side of page contains five tabs, each providing a different views and functionality to perform various types of crash analysis. The five tabs are as follows:
•Crash Data - This is the default tab that displays a grid of crashes from the designated study area and study period that are included in the investigation
•Summary Statistics - This tab provides crash summaries of key variables (e.g., light condition, crash severity, road surface, etc.) in various formats, including tabular grids, bar charts, and pie charts
•Statistical Tests - This tab provides functionality allowing the user to conduct a "test of proportions" to identify crash types and severities that are over-represented at the location of interest compared to “average” conditions.
•Collision Diagrams - This tab allows the users to create one or more collision diagrams, which can allow a user to diagram specifically where crashes are occurring and to graphically illustrate crash patterns associated with each location under investigation.
•Site Conditions - Allows the user to upload photos from a site visit to capture the site conditions
A detailed description of the functionality available within each tab is described in the sections below.
Crash Data Tab
The Crash data tab is the default tab that is first displayed when the Crash Analysis page is entered. This tab displays a grid/list of crashes from the designated study area and study period that are included in the investigation (i.e., if a crash was excluded during the crash review it will not appear in the grid). The grid includes crash details related to the case number, date and time of crash, number of vehicles involved, crash type and severity, light condition, roadway alignment, and surface and weather condition. If anything stands out from the initial review of individual crashes, the analyst can select crash patterns and contributing factors in for later use in countermeasure selection.
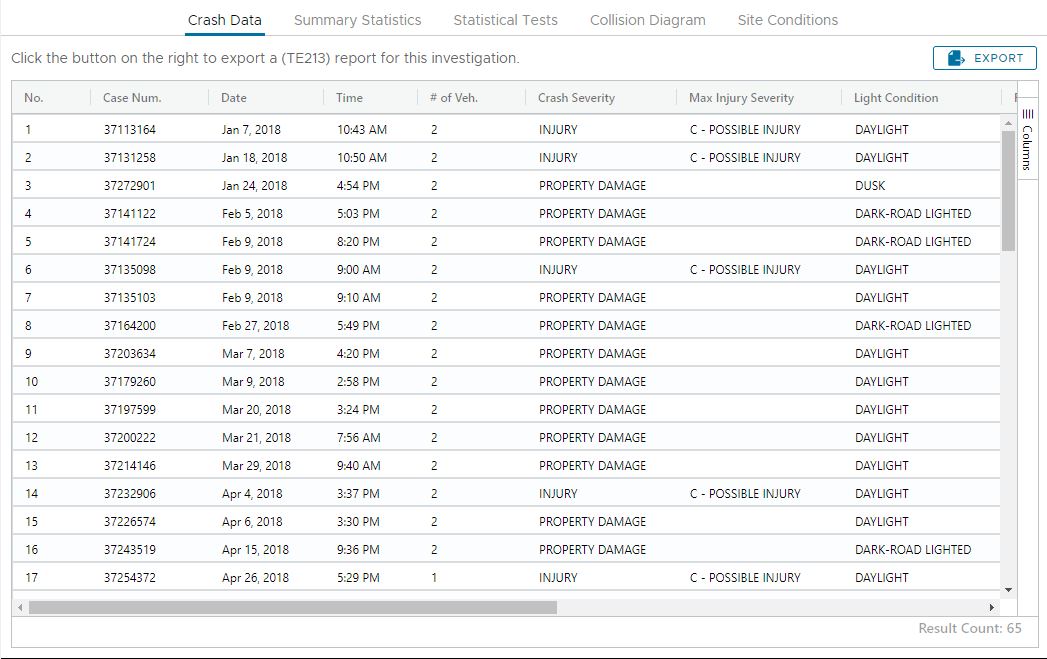
Analysts have the option to automatically export the list to a report (e.g., TE213) for the investigation by clicking the EXPORT button at the top of the grid.
Adding Contributing Factors and Observed Crash Patterns
During the Crash Analysis step, as the user analyzes the crash data, the user can record both observed crash patterns as well as contributing factors from the left panel for later use in countermeasure selection. The left panel has accordion panels that can be expanded to allow users to add both.
Adding Contributing Factors
To add a selected contributing factor, from the left panel, click the "Contributing Factors" accordion panel header. A list of available contributing factors is displayed. To select a contributing factor, check one or more boxes from the available contributing factors list and then click the TRANSFER button (blue down arrow) icon below the list. The checked contributing factors are transfered down to the "Selected Contributing Factors" list box at the bottom of the panel. To remove a selected contributing factor, click the red X button within the "Selected Contributing Factors" list.
Adding Crash Patterns
To add an observed crash pattern, from the left panel, click the "Crash Patterns" accordion panel header. A list of available crash patterns is displayed. To select a crash pattern, check one or more boxes from the "Available Crash Pattern" list and then click the TRANSFER button (blue down arrow) icon below the list. The checked crash patterns are transfered down to the "Observed Crash pattern" list box at the bottom of the panel. To remove a crash pattern , click the red X button within the "Observed Crash Pattern" list.
Recording Notes
Exporting the Contributing Factors and Crash Patterns
To export the list of contributing factors and observed crash patterns that were selected within the investigation, click the EXPORT button within either accordion panel. A PDF file is generated containing both lists.
Summary Statistics
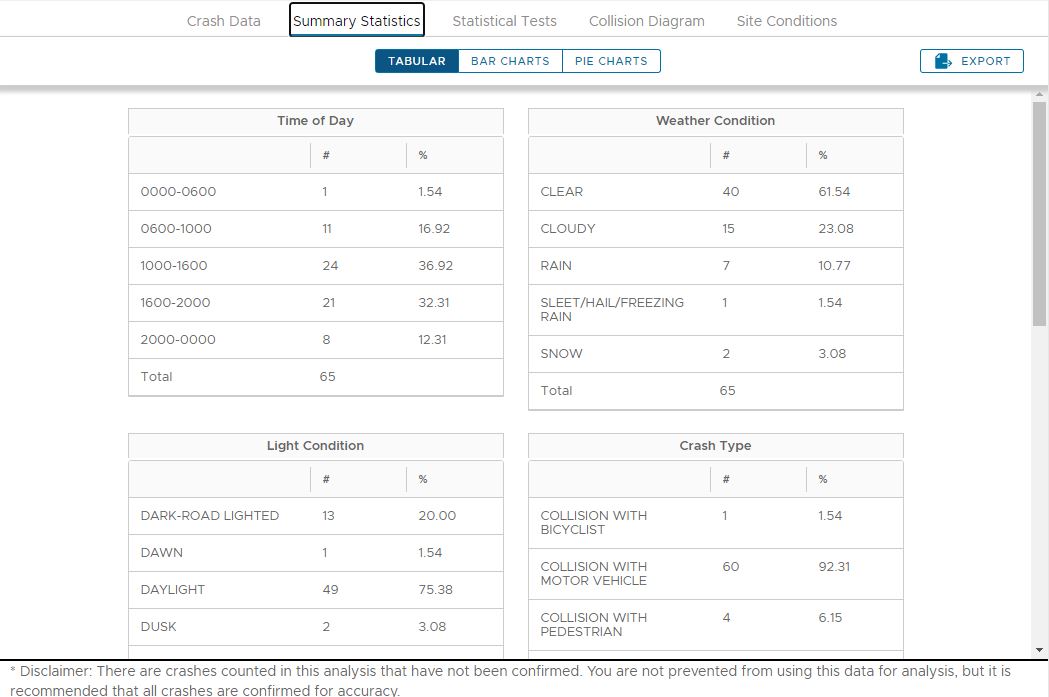
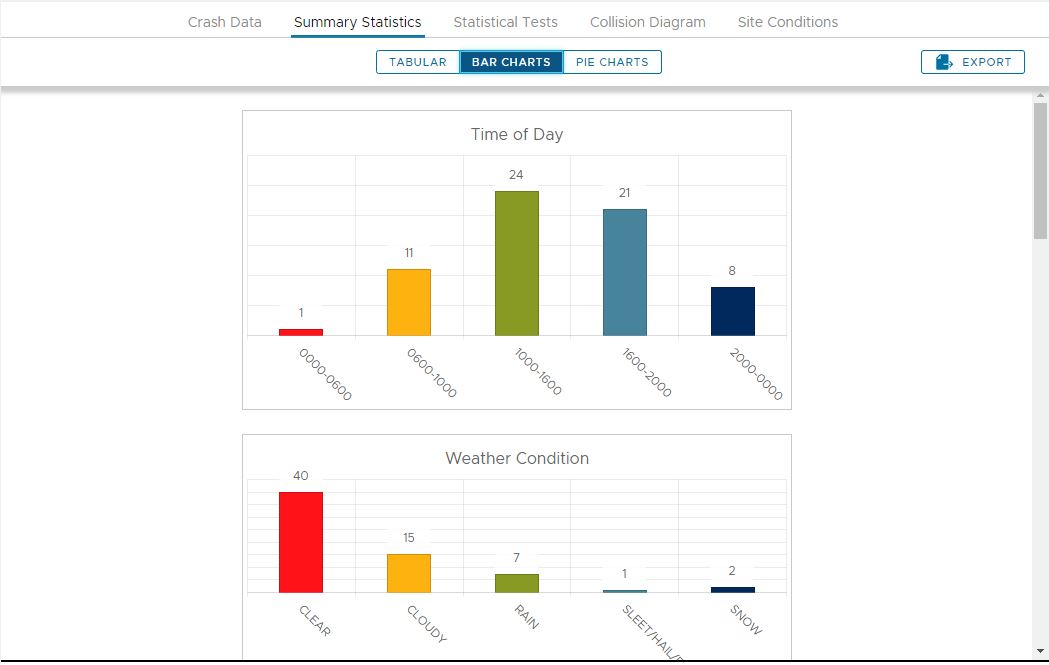
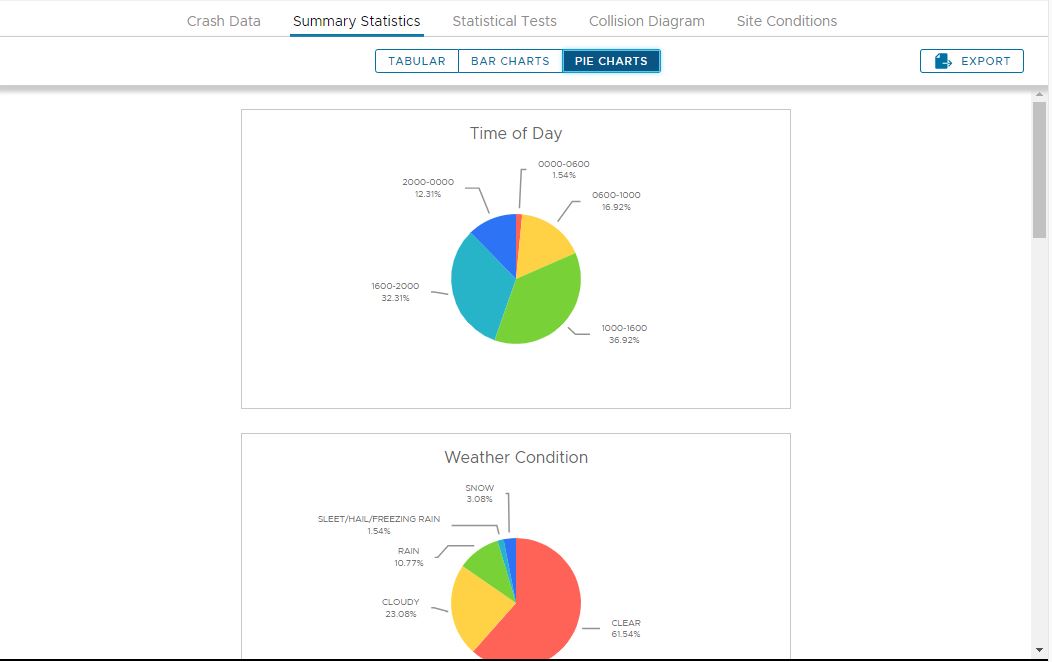
This tab provides crash summaries in various formats, with three sub-tabs allowing the user to switch views between Tabular view, Bar Charts and Pie Charts. The Default Summary group of variables include time of day and month of year, weather and road surface condition, light condition, crash type, and crash severity. Analysts can use this tab to also show summaries of specific variables beyond these defaults (such as alcohol-related, collision type, day of week, drug-related, vehicle type, and work zone). Further, analysts can generate summaries by emphasis area (such as intersections, lane departures, etc.). Similar to the crash data tab analysts have the option to export the summary statistics to a PDF by clicking the EXPORT button in the upper right corner.
Tabular View
The tabular view presents a grid for each variable displayed indicating the breakdown of crashes (along with percentage) for each value or range of values (as shown in the image below)
Bar Chart View
The bar chart view presents a bar chart for each variable displayed indicating the breakdown of crashes for each value or range of values (as shown in the image below)
Pie Chart View
The pie chart view presents a pie chart for each variable displayed indicating the breakdown of crashes for each value or range of values (as shown in the image below)
Showing a Specific Summary Variable
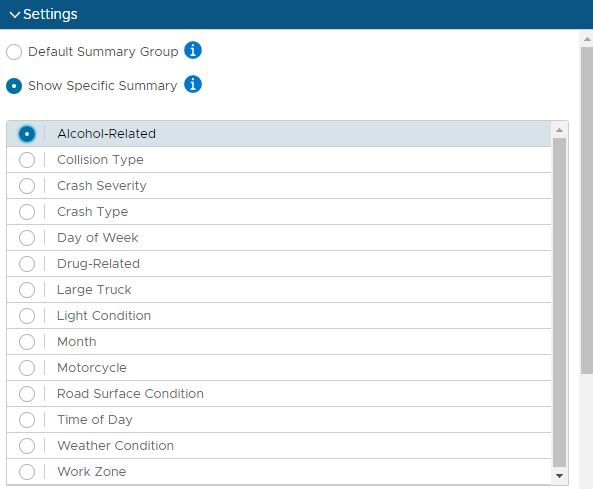
By default the summary statistics in all views (tabular, bar charts, pie charts) are generated for the default summary group of variables. To select a specific, single variable to display, from the "Settings" accordion panel on the left, click the "Show Specific Summary" radio button and the list of variables available will be activated. Click the radio button to the left of the desired variable and the display will change on the right to reflect this variable (only a single variable can be selected at once). To switch back to the default summary group of variables, click the "Default Summary Group" radio button.
Showing an Emphasis Area Summary
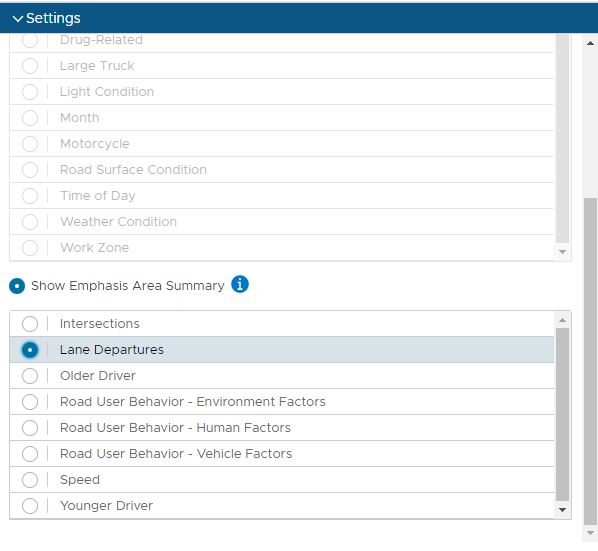
In addition to being able to display summary statistics of specific crash variables, the summary statistics can be shown for specific emphasis areas as well. To select a specific emphasis area, from the "Settings" accordion panel on the left, click the "Show Emphasis Area Summary" radio button and the list of emphasis areas available will be activated. Click the radio button to the left of the desired emphasis area and the display will change on the right to reflect this (only a single emphasis area can be selected at once). To switch back to the default summary group of variables, click the "Default Summary Group" radio button.
Statistical Tests
In addition to descriptive statistics, statistical tests can help to identify crash types and severities that are over-represented at the location of interest compared to “average” conditions. Specifically, this tab provides a statistical test that compares the proportion of “target crashes” for the location of interest to the statewide average for similar locations (for details on the specific equation that is used, please refer to the Yellow Book). If the probability from is close to 1.0, then the probability of experiencing ‘x’ or more target crashes is very small, indicating the subject crashes at the location of interest are different from the norm and warrant further investigation. If the probability is close to 0, then the probability of experiencing ‘x’ or more target crashes is very large, indicating the subject crashes at the location of interest are similar to the norm, and other crash types may warrant more attention.

To perform the test, select one or more target crashes by checking boxes in the "Target Crash Categories" picklist. Next, select the desired Target Crash Severities from the second picklist, and then click the UPDATE button. As shown in the screenshot below the grid is populated with the results of the test for each site. The grid can be exported to a CSV file by clicking the EXPORT button above the grid. At the conclusion of this step, the analyst should review and update the list of crash patterns and contributing factors accordingly.
Collision Diagrams
The collision diagram tab provides a tool that can be used to quickly identify where crashes are occurring and to graphically illustrate crash patterns associated with each location under investigation. Users can create one or more diagrams within an investigation. The tool provides users the opportunity to relocate the crashes, change default crash symbols, view police officers’ crash diagrams and narratives, group and ungroup crashes by types, color code crashes, mark up road names, save and print the collision diagram in varied templates, and save the diagram.
To create a new collision diagram, click the NEW DIAGRAM button. This launches the collision diagramming tool in a new browser tab with the map zoomed out showing the crashes clustered at the center as shown in the image below.
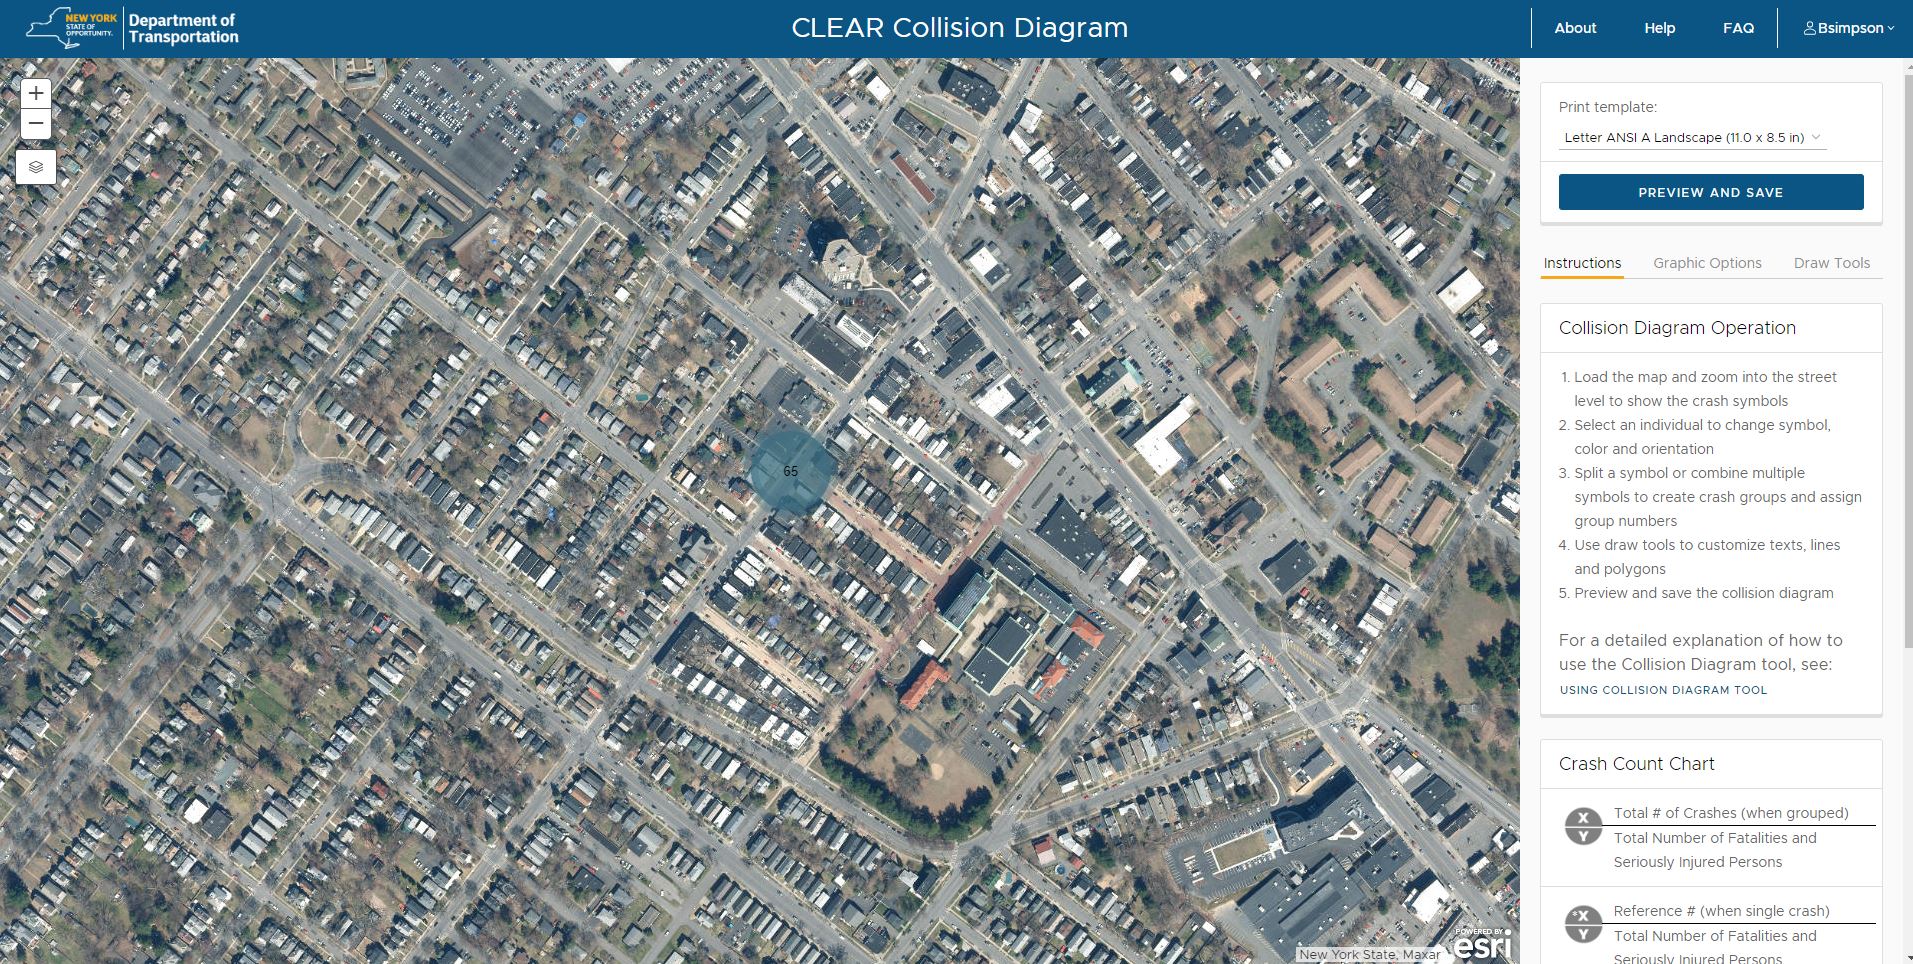
As the user zooms in, the cluster of crashes will breakout to smaller clusters and ultimately show the crash count symbology in a more detailed manner. The crash count symbols (grey circles) can be selected with the mouse and repositioned manually to improve readability.
It may be useful to add details or change the colors to represent other basic crash characteristics such as weather and light condition. The tool allows the analyst to load a map and zoom to the desired extent for the diagram. Users then have the option to:
1.Select an individual crash to change the symbol, color, and orientation.
2.Split a symbol or combine multiple symbols to create crash groups and assign group numbers.
3.Use draw tools to customize texts, lines, and polygons.
4.Preview and save the collision diagram
The following provides guidance on editing a collision diagram from the “Graphics Options” tab.
•Crash Type Symbols: By default, crashes are loaded to the map with symbols that correspond to the “crash type” in the crash data. A circle notation is added to each symbol that shows the total number of crashes (top) and total number of fatalities and injuries (KABC, bottom). The crash statistic will automatically update when users make any changes to the collision diagram that affect the crash summary of each group.
•Select Crash/Select Crash Group: This allows users to select and jump to a group of crashes to view crash details. Again, the initial groups here are automatically clustered by the tool from the beginning. Selecting a crash group can also be achieved by clicking the crash group icon on the map, and the selected crash group will be highlighted. Then the crash information will be displayed in the lower part of the right panel. Users can click “LOAD DETAILS” to review the narrative and police officer’s collision diagram for each crash, which will be helpful for users to verify and adjust the collision diagram later.
•Rotate Crash Type Symbols: The “Rotate” slider bar allows users to adjust the orientation of the symbols.
•Change Symbols: The “Symbol” tool allows users to adjust existing symbols. For example, users may review the crash details and find that some crashes have incorrect crash types. Then they can choose the correct symbols to replace the default ones. The tool also allows users to change colors of the symbols.
•Change Callout Bubble Color: Users can select a new color for the crash count callout bubble. Once a new color is selected, all bubbles will be updated to the new color.
•Relocate Symbols: Users can check the detailed crash narrative and police officer’s diagram, and drag the symbols to their actual locations.
•Remove and Restore Group: Users can remove any group symbols if users find they should not be included in the intersection. The removed crashes by group will be listed on the right. The tool also allows users to review the removed crashes by group and restore them.
•Add Crashes to an Existing Group: Users can manually group and ungroup crashes. When users find that some crashes in an original group should be moved to another group, they could make such changes within the tool. For example, in Figure 57, one crash in the green symbol should be moved to the cyan symbol, due to the location adjustment. Now users need to click the green symbol, and all the crashes in the green symbol are displayed in the right panel under “Current Crash Group Members”. Then the users can click “move crash” for the targeted crash under the green symbol, and the targeted crash is listed under the “Members for New Crash Group”. Users now need to select the cyan symbol , click the “Add All” and then “Create New Group” and the crash is moved to the Cyan symbol, which is actually shown as a new black symbol circled in red. As mentioned earlier, the crash statistic is updated automatically.
•Create a New Group: When users want to move some crashes out of a group, and use them to create a new group instead of merging them to another group, the user can just repeat the above process within a single group, and create a new group with all selected crashes by clicking the “Create New Group” directly from the initial group
•Assign Group Indicator: The tool allows users to assign a letter to each group after completing the collision diagram. Users can click an individual symbol and pick a letter from the “Select Letter Group”. The letters that are previously assigned will be disabled for other groups, until the letters are deleted from the previous groups.
•Draw Tools: Other than the collision diagram development functions, the tools also allows users to add edits to the diagram, including drawing points, lines, circles, polygons and texts. Users need to click the second tab “Draw Tools” to access these additional functions.
•Saving the Collision Diagram: The tool allows reporting the created collision diagram with the date and severity of all crashes included in each group assigned above. Users can click the PREVIEW AND SAVE button to preview the diagram elements that will be included in saved version.
Once the collision diagram is saved, the browser tab can be closed and back within CLEAR Safety, the refresh button can be clicked which will then show the new diagram in the list of diagrams in the left panel.
Site Conditions
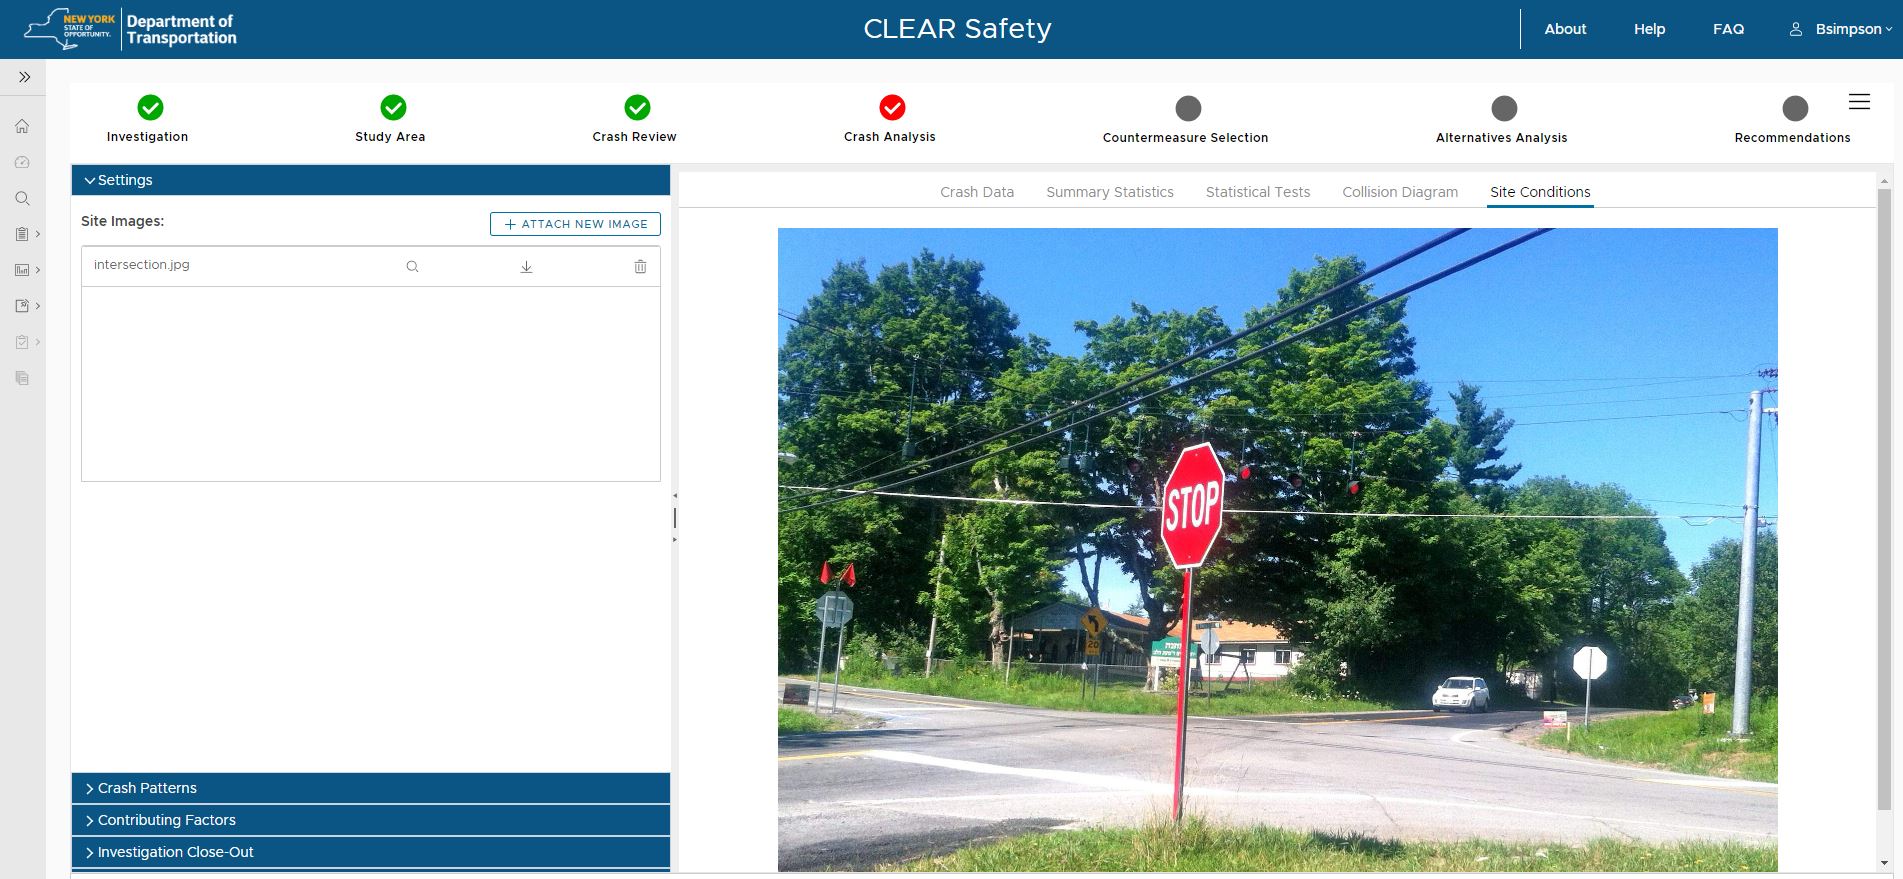
This tab allows the user to upload photos from a field visit to capture the site conditions. To upload a photo, click the ATTACH NEW IMAGE button within the Setting panel on the left. A file dialog is displayed. Navigate to the file to be uploaded, select the file and click the OPEN button. The photo is then uploaded and added as a row to the Site Images grid on the left panel, and the photo is displayed on the right panel, as shown in the image below. The Site Images grid on the left provides three buttons allowing the user to view the image (magnifier icon), download the image (arrow down icon), or remove the image from the investigation (trash icon).
Closing out an Investigation
If the investigation did not result in any recommendations, or if the investigation is simply a site review or preliminary study (e.g., such as part of a Traffic Operations study), you can complete the investigation by clicking the Investigation Close-Out accordion panel, entering comments on the findings and click the FINALIZE button.
Once the crash analysis is complete, the user can click the NEXT > button to proceed to the next step.
|